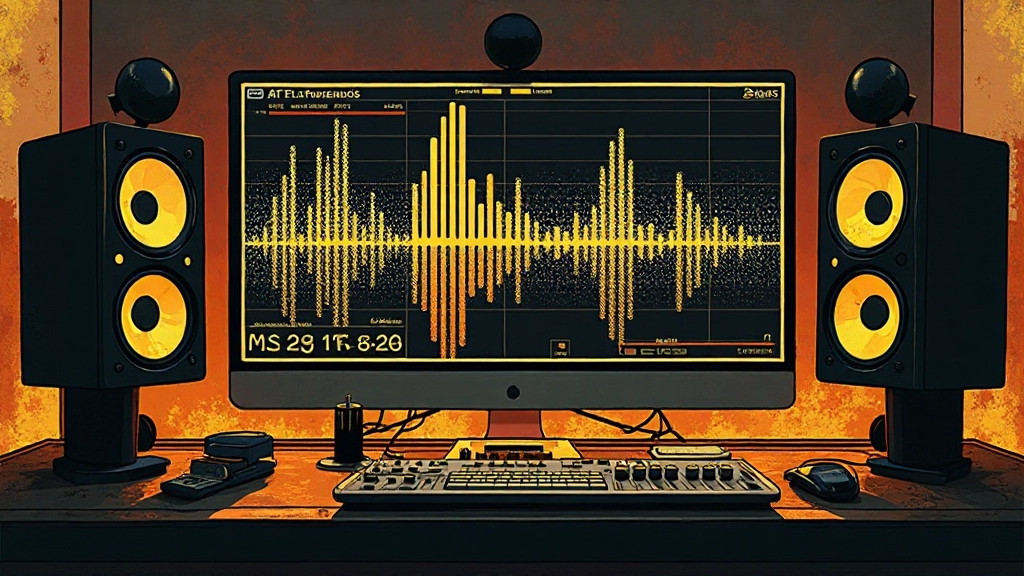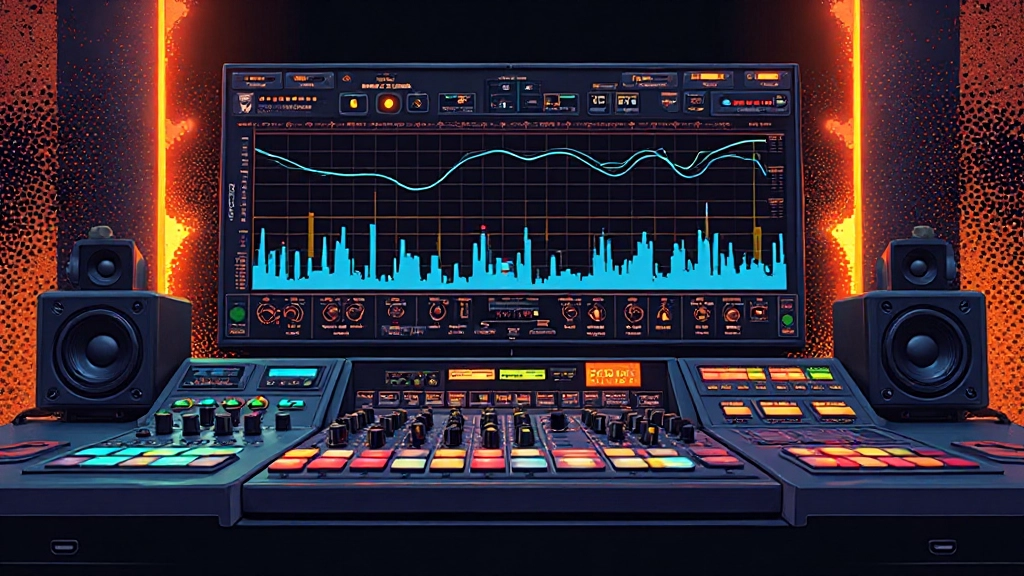
Dynamic EQ plugins show you real-time frequency response, threshold activity, and gain reduction numbers that change as your music plays. But those dancing meters and shifting curves can feel like reading a foreign language when you're trying to make mix decisions. Understanding what each reading actually tells you about your audio makes the difference between guessing at settings and making precise adjustments that solve specific frequency problems.
Quick Takeaways
- Threshold meters show when frequency-specific processing kicks in, not how much you're cutting or boosting
- Gain reduction displays tell you the real-time amount of EQ adjustment happening at each band
- Frequency response curves shift dynamically, so screenshot comparisons during loud vs. quiet sections reveal problem zones
- Attack and release times affect how quickly the EQ responds to changes, visible in meter movement speed
- Side-chain input meters help you understand what signal is triggering the dynamic response
When Your Dynamic EQ Meters Disagree With What You Hear
The meters might show heavy activity around 200Hz while your low end still sounds muddy and unclear. This disconnect happens when the dynamic EQ is responding to the wrong part of your signal or when your monitoring environment masks the actual changes happening. The threshold might be set too high, meaning the EQ only engages during the loudest peaks, leaving the sustained muddy frequencies untouched during verses and quieter sections.
Check this by watching the gain reduction meters during different song sections. If you see -2dB to -4dB of reduction only during the chorus but no activity during verses, your threshold needs to come down. The muddiness you hear during the verse isn't being addressed because the dynamic EQ thinks the problem only exists during loud parts.
Another common issue occurs when the frequency range is too narrow. You might target 180Hz with a tight Q, but the actual problem spans from 150Hz to 250Hz. The meters show activity right at 180Hz, but the broader frequency range remains unprocessed. Widen the Q setting and watch how the meters respond across a broader range.
Reading Threshold Activity for Precise Frequency Targeting
Threshold meters light up when incoming signal crosses your set level, but they don't show you the musical context of when that happens. A threshold set at -18dB might trigger constantly if your track has a loud, sustained bass line, or it might barely activate if your bass has short, punchy notes with quiet spaces between.
Set your threshold while listening to the busiest section of your song. If you're trying to control low-mid buildup during the full chorus, don't set the threshold based on a sparse verse. Loop the chorus and adjust the threshold until you see consistent but not constant activity. You want the meters to show engagement during the problematic moments, not throughout the entire section.
For vocals that get harsh only when the singer pushes into their upper range, set the threshold based on those loud, bright notes. Watch the meters during quieter vocal phrases - they should stay mostly inactive, only lighting up when the harshness actually appears. This selective triggering preserves the natural vocal tone during softer moments while controlling problems only when they occur.
Gain Reduction Numbers That Actually Matter
Gain reduction meters show you how much EQ adjustment is happening in real-time, but the numbers that matter depend on what you're trying to fix. For controlling harsh vocal consonants around 5kHz, you might see quick spikes of -1dB to -3dB that last only milliseconds. This is normal and effective - harsh consonants are brief, so the gain reduction should be brief too.
For taming boomy low-mids around 200Hz on a bass guitar, you might see steadier gain reduction of -2dB to -6dB that follows the bass notes. This sustained reduction makes sense because the boom happens throughout each bass note, not just at the attack. If you see constant -8dB or more, your threshold might be too low, turning your dynamic EQ into a static cut.
| Frequency Problem | Typical Gain Reduction Range | Expected Meter Behavior |
|---|---|---|
| Vocal harshness (3-5kHz) | -1dB to -3dB | Quick spikes during consonants and loud notes |
| Bass boom (150-300Hz) | -2dB to -6dB | Steady reduction following bass note sustain |
| Drum resonance (varies) | -1dB to -4dB | Sharp spikes at drum hits, quick return to zero |
| Guitar muddiness (200-400Hz) | -2dB to -5dB | Moderate activity during chord strums |
| Kick/bass conflict (80-120Hz) | -1dB to -3dB | Rhythmic pumping matching kick pattern |
Understanding Response Curve Changes
The visual EQ curve in your plugin shifts in real-time as the dynamic processing engages. During quiet sections, the curve might appear flat, showing no EQ adjustment. As the problematic frequencies appear, you'll see the curve dip or peak at your target frequency. These curve changes help you understand not just how much processing is happening, but exactly where in the frequency spectrum.
Screenshot the curve during both active and inactive states. The difference between these two images shows you the maximum range of adjustment your settings will create. If the difference is too subtle, you might need more aggressive settings. If the curve swings wildly between the two states, your attack and release times might be too fast, creating audible pumping.
Side-Chain Input Meters for Advanced Control
Many dynamic EQs let you use a different signal to trigger the processing, showing input meters for both the main audio and the side-chain source. When you're using the kick drum to trigger low-end reduction on the bass, the side-chain meter shows the kick's level while the gain reduction meter shows how much bass EQ is happening.
The side-chain input should show clear, consistent peaks when your trigger event happens. If you're using the kick to duck bass around 100Hz, the side-chain meter should spike cleanly with each kick hit. Weak or inconsistent side-chain readings mean your trigger signal needs more level or a different frequency focus to work reliably.
For multiband side-chain setups, some plugins show frequency-specific input metering. You might send a full drum mix to trigger bass reduction, but only use the 60Hz-120Hz range of the drums as the actual trigger. The input meter should reflect this filtered range, not the full drum signal, so you can see what's actually controlling the dynamic response.
Attack and Release Time Visual Feedback
Fast attack and release times create quick, sharp movements in your gain reduction meters. Slow times create gradual, smooth meter movements. The visual feedback helps you dial in timing that matches your musical material without relying entirely on your ears, especially in untreated rooms where you might not hear subtle pumping or breathing artifacts.
For natural-sounding vocal de-essing around 7kHz, set your attack fast enough that the meters respond quickly to sibilant consonants, but slow your release so the meters don't snap back to zero instantly. You should see the meters spike quickly on "s" and "t" sounds, then gradually return to zero over 50-200 milliseconds. This creates smooth de-essing without obvious processing artifacts.
When controlling bass resonance, slower attack times often work better. The meters should show a gradual rise to peak gain reduction rather than instant response. This prevents the dynamic EQ from reacting to the attack portion of bass notes, focusing instead on the sustained fundamental frequency where the actual boom occurs.
Common Dynamic EQ Meter Mistakes That Backfire
Setting thresholds based on peak meter readings rather than sustained levels leads to ineffective processing. Your meters might show occasional activity during the loudest moments, but the frequency problems you're trying to solve exist throughout most of the song at lower levels. The dynamic EQ becomes a peak limiter rather than a musical problem-solver.
Watching only the gain reduction meters while ignoring the frequency response curve can mislead you about what's actually happening. You might see -3dB of gain reduction and assume you're getting effective control, but if the Q setting is too narrow, you're only affecting a tiny slice of the problematic frequency range. The curve visualization shows you the real impact on your audio.
Another common mistake is setting attack and release times based on meter appearance rather than musical timing. Smooth, slow meter movements might look more professional, but if your source material has quick transients, slow timing creates lag between the problem and the solution. The meters should match the musical timing of your source, not look pretty.
Work It in Your DAW: Dynamic EQ Setup Checklist
- Load your dynamic EQ on the problem track - Start with a preset close to your target application (vocal, bass, etc.)
- Set frequency and Q while bypassing dynamics - Use static EQ mode to find the exact problem frequency first
- Enable dynamic mode and set initial threshold - Start with threshold at -12dB and adjust based on your signal level
- Loop the most problematic section - Focus on the part of the song where the frequency issue is most obvious
- Adjust threshold until meters show activity only during problem moments - Not constant activity, but clear engagement when needed
- Fine-tune attack time - Fast enough to catch the problem, slow enough to avoid artifacts
- Dial in release time - Should return to zero naturally without pumping or hanging
- Check gain reduction range - Typically -1dB to -6dB depending on the application
- Screenshot curve during active and inactive states - Verify the visual difference matches your sonic goals
- A/B test with full mix - Ensure the meter readings translate to audible improvement in context
What to Check Before Final Export
Before you bounce your mix, solo each track with dynamic EQ and play through the entire song while watching the meters. Look for sections where the processing behavior changes unexpectedly - maybe the threshold works perfectly in the verse but becomes too sensitive during a quiet bridge. These inconsistencies might not be obvious in the full mix but become problems when the track gets mastered or played on different systems.
Check your gain reduction meters during the loudest and quietest parts of your song. The processing should scale appropriately - less activity during quiet sections, more during loud sections, but never completely inactive for long periods if you're addressing a frequency problem that exists throughout the track. If you see no meter activity for entire verses, your threshold might be set too high for the dynamic range of your mix.
Export a version with dynamic EQ bypassed and another with it active. Load both into a reference player and use spectrum analysis to verify that the frequency adjustments you see in your plugin meters actually translate to measurable differences in your bounced audio. Sometimes plugin meters show activity that doesn't make it through complex signal chains or when using certain oversampling settings.
For tracks heading to mix feedback or professional mastering, include notes about your dynamic EQ settings and what specific problems you were addressing. This helps the mastering engineer understand your intent and avoid undoing your frequency corrections during their process.
False Fix: Trusting Meters Over Musical Context
Dynamic EQ meters can show perfect technical behavior while creating musical problems. The gain reduction might be smooth and consistent, hitting your target range, but if the threshold is triggering based on drums hits instead of the actual bass frequency you want to control, you're reducing bass level rhythmically rather than addressing frequency balance. The meters look correct, but the musical result is wrong.
This happens frequently when using dynamic EQ to solve kick and bass conflicts. The meters might show -3dB reduction at 80Hz every time the kick hits, which looks like effective side-chain control. But if the bass and kick are already well-separated in timing, you're creating an unnecessary ducking effect rather than solving an actual frequency masking problem. Trust your ears over meter readings when the musical relationship doesn't improve despite technically correct meter behavior.
Similarly, consistent meter readings don't guarantee musical consistency. A dynamic EQ might reduce 3kHz harshness by -2dB throughout the entire vocal track, showing steady, professional-looking meter activity. But if some of those -2dB reductions happen during soft, breathy vocal moments that weren't actually harsh, you're removing natural vocal character along with the problems. The meter readings look ideal, but the vocal loses its expressive range.
Reference Track Comparison Using Dynamic EQ Meters
Load your reference track and run it through the same dynamic EQ settings you're using on your mix. Compare the meter behavior between your track and the reference. If your vocal dynamic EQ shows constant heavy activity while the reference track shows occasional light activity, your vocal might have more consistent harshness that needs addressing earlier in the signal chain, not just dynamic control.
Pay attention to the frequency ranges where commercial tracks trigger dynamic processing. Professional mixes often need less dramatic dynamic EQ because problems were solved during recording and mixing. If your meters show significantly more activity than similar commercial tracks, consider whether you can solve some issues with static EQ, compression, or arrangement changes before relying on dynamic frequency control.
When comparing loudness, make sure both tracks hit similar peak levels in your DAW before comparing dynamic EQ behavior. A reference track that's 3dB louder will trigger thresholds differently, making meter comparisons misleading. Use a gain plugin before the dynamic EQ to level-match, then compare the processing behavior on equal-loudness material.
Advanced Meter Reading for Multiband Applications
When using dynamic EQ across multiple frequency bands simultaneously, each band's meters tell you a different part of the story. For full-mix bus processing, you might have bands at 100Hz, 500Hz, 2kHz, and 8kHz working together. The relationship between these meter readings reveals how different frequency ranges interact as the mix gets loud and dense.
During a busy chorus, you might see activity at 500Hz (low-mid cleanup) and 2kHz (vocal clarity) but not at 100Hz or 8kHz. This suggests your mix has good low-end and high-end control but needs frequency management in the midrange where multiple elements compete. Use this information to guide arrangement decisions or individual track processing before relying entirely on mix-bus dynamic EQ.
For AI stem mixing guide preparation, clean dynamic EQ meter readings help automated systems make better decisions. Stems with wild, inconsistent dynamic EQ activity often confuse AI mixing algorithms, while stems with purposeful, controlled dynamic processing translate better through automated mixing workflows.
Common Questions About Dynamic EQ Meter Readings
Why do my dynamic EQ meters show activity but I don't hear any change?
Your threshold might be set too high, causing the EQ to trigger only during peaks while leaving the sustained problem frequencies untouched. Lower the threshold until you see more consistent activity during the problematic parts of your audio, not just the loudest moments.
How much gain reduction should I see for effective vocal de-essing?
Typically -1dB to -3dB during sibilant consonants like 's' and 't' sounds. The meters should spike quickly then return to zero, not show constant reduction. More than -4dB often makes vocals sound lispy or unnatural.
What does it mean when my side-chain input meters are weak?
Your trigger signal might be too quiet or filtered incorrectly. Boost the side-chain input level or adjust the frequency filtering so the meters show clear, strong peaks when your trigger event occurs. Weak side-chain signals create inconsistent dynamic response.
Should dynamic EQ meters move smoothly or show sharp spikes?
It depends on your source material. Percussive elements like drums should create sharp meter spikes with quick returns. Sustained elements like bass or vocals should show smoother meter movements that follow the musical phrase timing.
Why does my frequency response curve look different during playback?
Dynamic EQs adjust their response in real-time based on incoming audio. The curve shifts as processing engages and releases. Screenshot the curve during both active and inactive states to see the full range of adjustment your settings create.
Can I trust dynamic EQ meters in solo mode or should I watch them in the full mix?
Check both contexts. Solo mode helps you dial in precise settings for the individual track, but full mix context shows how the processing behaves when competing with other elements. The threshold and timing might need adjustment when other instruments mask or emphasize the target frequencies.
Hear what these choices do to your own song.
Upload stems or a finished track, choose a reference direction, and compare a private Moozix mix before you export anything.